Pull up three real estate sites for Rowayton this week and you will land on three different snapshots of the same two square miles, each pinned to a different month. One site's neighborhood page is still showing a November 2025 read: prices up 60 percent from the year before. A few rows down on that identical page, a different measure from that identical month shows the average price down 17 percent. A second site's overview tab, refreshed as recently as February 2026, put the yearly gain closer to 10 percent. A third source, tracking a rolling twelve months as of this writing, lands closer to 11 percent.
None of these numbers is wrong. That is the part worth sitting with if you are comparing Rowayton against Westport, Weston, or Fairfield and trying to work out what your money actually buys here. The disagreement is not a data error. It is what happens when a market this small is asked to produce a single headline figure every month.
The Same Company, Two Opposite Headlines
Redfin's own Rowayton pages illustrate the problem inside a single source. As of this writing, the neighborhood's dedicated housing-market page is still anchored to a November 2025 snapshot: the median sale price is listed at $2.8 million, up 60.5 percent year over year, on 11 recorded sales that month, down from 21 the year before. A few rows down on that same page, the average home price is listed at $2.44 million, down 16.8 percent year over year, and the median price per square foot is down 20.6 percent, both drawn from that identical November window. Same source, same month, two measures of the same market moving in opposite directions by double digits.
This is less a contradiction to untangle than a demonstration of what a median does when the sample gets small. Eleven sales is not a trend line, it is eleven houses. If two or three of them happened to be architect-designed waterfront estates on Bell Island or in the Rowayton Beach Association, the median jumps. If the average and the per-square-foot figure fell in that same window, the likelier explanation is that the broader mix of what actually closed skewed toward smaller, less finished homes even as one or two outsized sales pulled the median upward. Both things can be true about the same eleven transactions at once.
| Source and reporting month | Metric | Figure |
|---|---|---|
| Redfin, November 2025 snapshot | Median sale price | $2.8M, up 60.5% year over year, 11 sales |
| Redfin, same November 2025 snapshot | Average sale price | $2.44M, down 16.8% year over year |
| Redfin, February 2026 overview | Median sale price | $2,445,000, up 10.3% year over year |
| Trailing twelve months, as of this writing | Median sale price | $2,220,000, up 11% |
| April 2026 active listings | Median list price | $2.49M, $892 per square foot, 15 days on market |
Four legitimate reads on the same village, and roughly a 26 percent spread between the highest and lowest figure. None of them is lying. They are answering slightly different questions, over slightly different windows, off a sample too thin to smooth out the noise.
Why Eleven Sales Moves the Needle and 150 Doesn't
Compare that to greater Norwalk, the city Rowayton sits inside. Norwalk logged 152 closings in June 2026 and 199 over the three months ending May 2026, a volume roughly ten to twenty times what Rowayton produces in a typical month. Across that same recent stretch, Norwalk's median sale price has been reported anywhere from about $718,000 to $756,000 depending on the exact window measured, a spread of roughly 5 percent. Rowayton's spread across the snapshots above was closer to 26 percent. The difference is not that one town collects better data. It is that a hundred and fifty transactions absorb an outlier sale without flinching, while eleven transactions cannot.
That volume gap matters for how you read anything you find about Rowayton specifically. A single luxury closing, a merged-lot estate, a new construction delivery, can move the reported median for the entire village in a way it never could for Norwalk as a whole.
One Zip Code, Several Different Markets
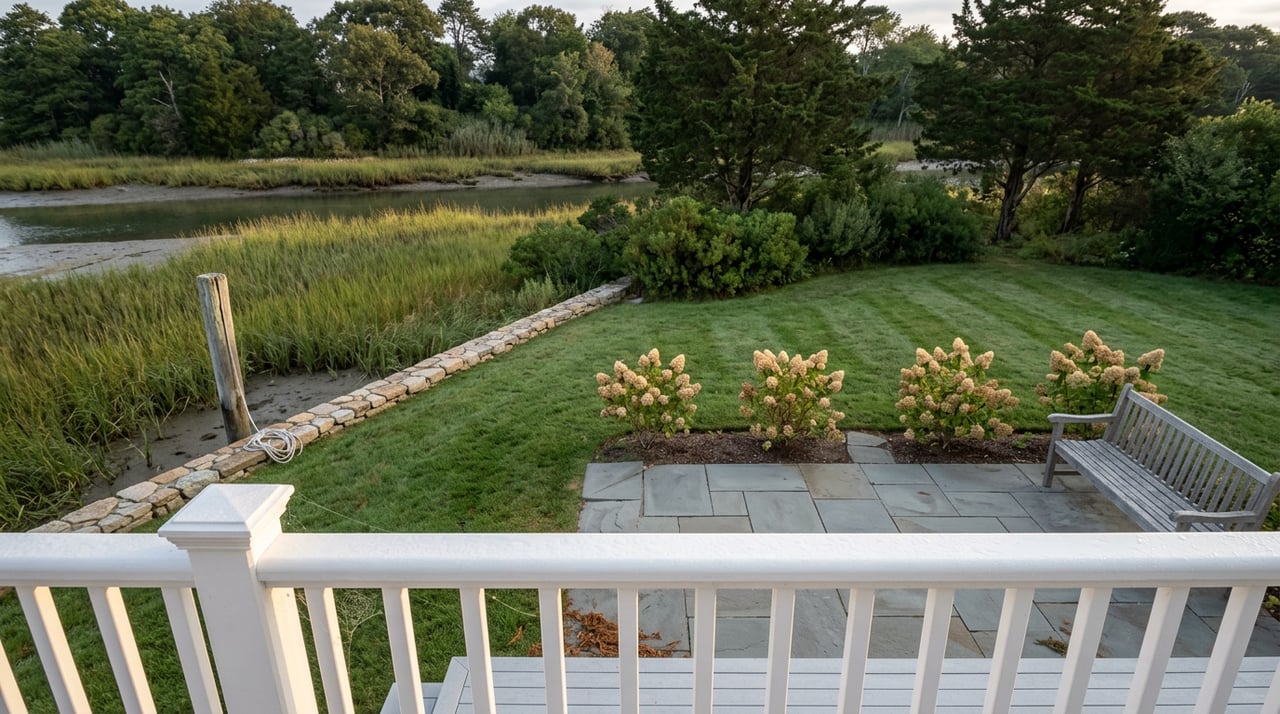
Part of what makes a blended Rowayton number so unstable is that Rowayton is not one market. It is several small ones sharing a mailing address.
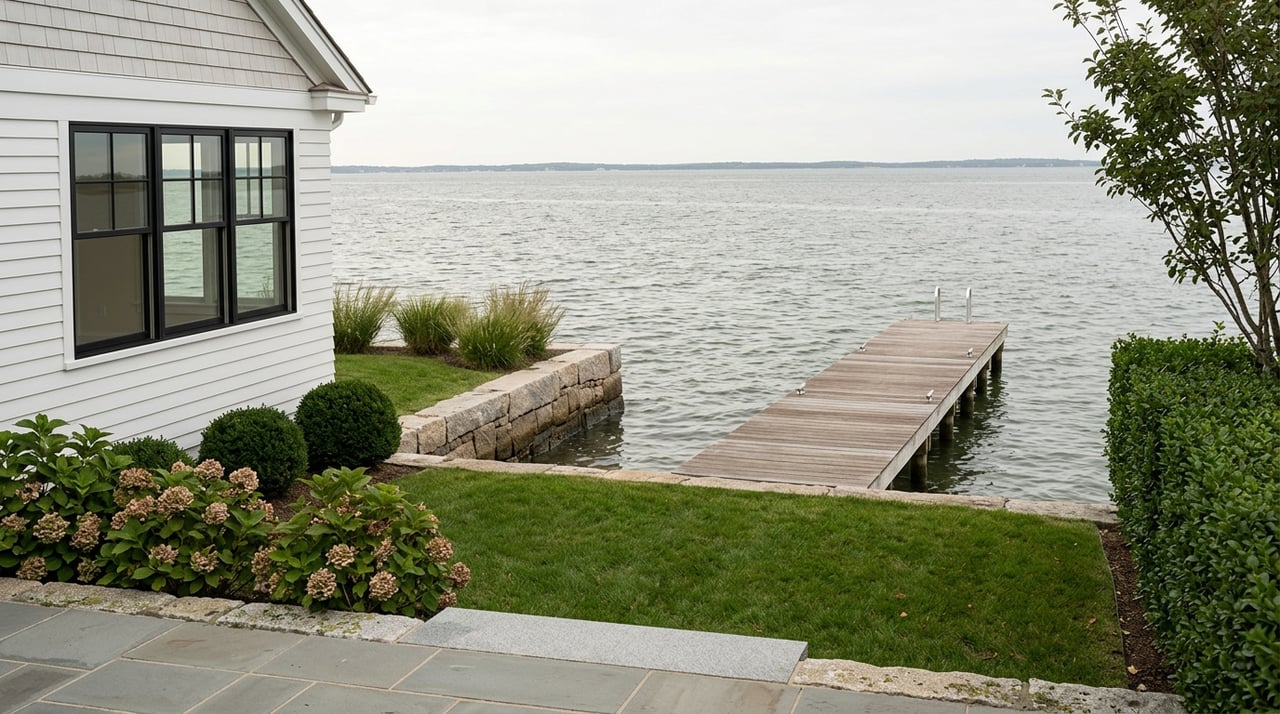
- Bell Island, where private beach rights come attached to modest cottage-scale homes as often as to architect-built estates
- The Rowayton Beach Association, where waterfront lots along the Five Mile River carry their own pricing logic
- Pine Point, a smaller enclave with its own association and its own comparable set
- The village center streets within walking distance of the train station, the library, and Pinkney Park, priced more on walkability than on water
- Inland Rowayton, where lot size and privacy do more of the pricing work than proximity to Long Island Sound
A home originally designed by architect Bruce Beinfield and later expanded when its owners merged two adjoining properties into one is not the same product, at any price, as a 1,748 square foot cottage on Bell Island with private association beach rights. Both are real Rowayton sales. Averaging them into one monthly figure tells you less about the market than it tells you about arithmetic.
The Federal Numbers Are Too Coarse to Help
If you are hoping a government dataset will settle the disagreement, it will not, at least not at this scale. The Federal Housing Finance Agency's official house price index for the Bridgeport-Stamford-Norwalk metro area is published quarterly and covers a tri-county region of nearly a million residents. It cannot see a two-square-mile village inside Norwalk any more clearly than a satellite photo can pick out a single porch light. That index is genuinely useful for tracking the broader coastal Fairfield County economy. It has nothing to say about what a buyer should expect to pay this month for a house on Wilson Cove versus one three blocks from the village market.
What to Watch Instead of the Median
None of this means Rowayton's pricing is unknowable. It means the headline percentage on any single site is the least useful number on the page. Two figures hold up better in a thin market.
Sales volume itself is one. When a neighborhood is producing single digits to low teens of closings a month, ask how many homes actually sold in the specific enclave you are considering over the past six to twelve months, not the past thirty days.
Days on market is the other. In that same November 2025 Redfin snapshot, Rowayton's average time to sale had fallen to 25 days, down from 35 a year earlier. That figure holds up better than any single median because it reflects behavior across the full pool of active listings, not just the handful that happened to close, though it is still worth confirming against what a local advisor is seeing in the specific enclave you are watching right now.
It also helps to know what is entering the pipeline. Builders including Sterling Associates LLC and Fox Hill Construction have active new construction and renovation work in the village, which means some of what closes in a given month is new product with no direct comparable in the existing housing stock. A single new-construction closing can distort a monthly median in a market this size just as easily as a legacy waterfront estate can.
A Short FAQ
Is Rowayton actually getting more expensive or not? Both things are happening at once, in different corners of the market. Waterfront and architect-built properties on Bell Island and in the Rowayton Beach Association have posted some of the larger recorded gains. The broader mix of what transacted in the same windows has, in some months, pulled average and per-square-foot figures down. A single yes or no answer flattens a market that genuinely contains both trends.
Which website should I trust? Trust the window and the sample size before you trust the percentage. A trailing twelve month median smooths more noise than a single month's snapshot. Neither replaces asking what actually sold in the specific association or street you are considering.
How many homes sell in Rowayton in a typical month? Recent reporting has ranged from about seven to eleven closings in a given month, occasionally higher. That is the number worth keeping in mind any time a headline percentage looks dramatic in either direction.
If you are cross-shopping Rowayton against Westport, Weston, or Fairfield and the portal numbers are not adding up, that instinct is correct. This is a market where the specific comparable set matters more than any blended average, and where the useful conversation starts with what actually closed on your street or in your association, not what a scraper published this month. Emily Gordon has spent three decades reading Fairfield County's coastal submarkets at exactly this level of detail. Let's Connect to talk through what the numbers in your specific corner of Rowayton actually mean, or start with a current home valuation to see where your property sits against what has genuinely sold nearby.